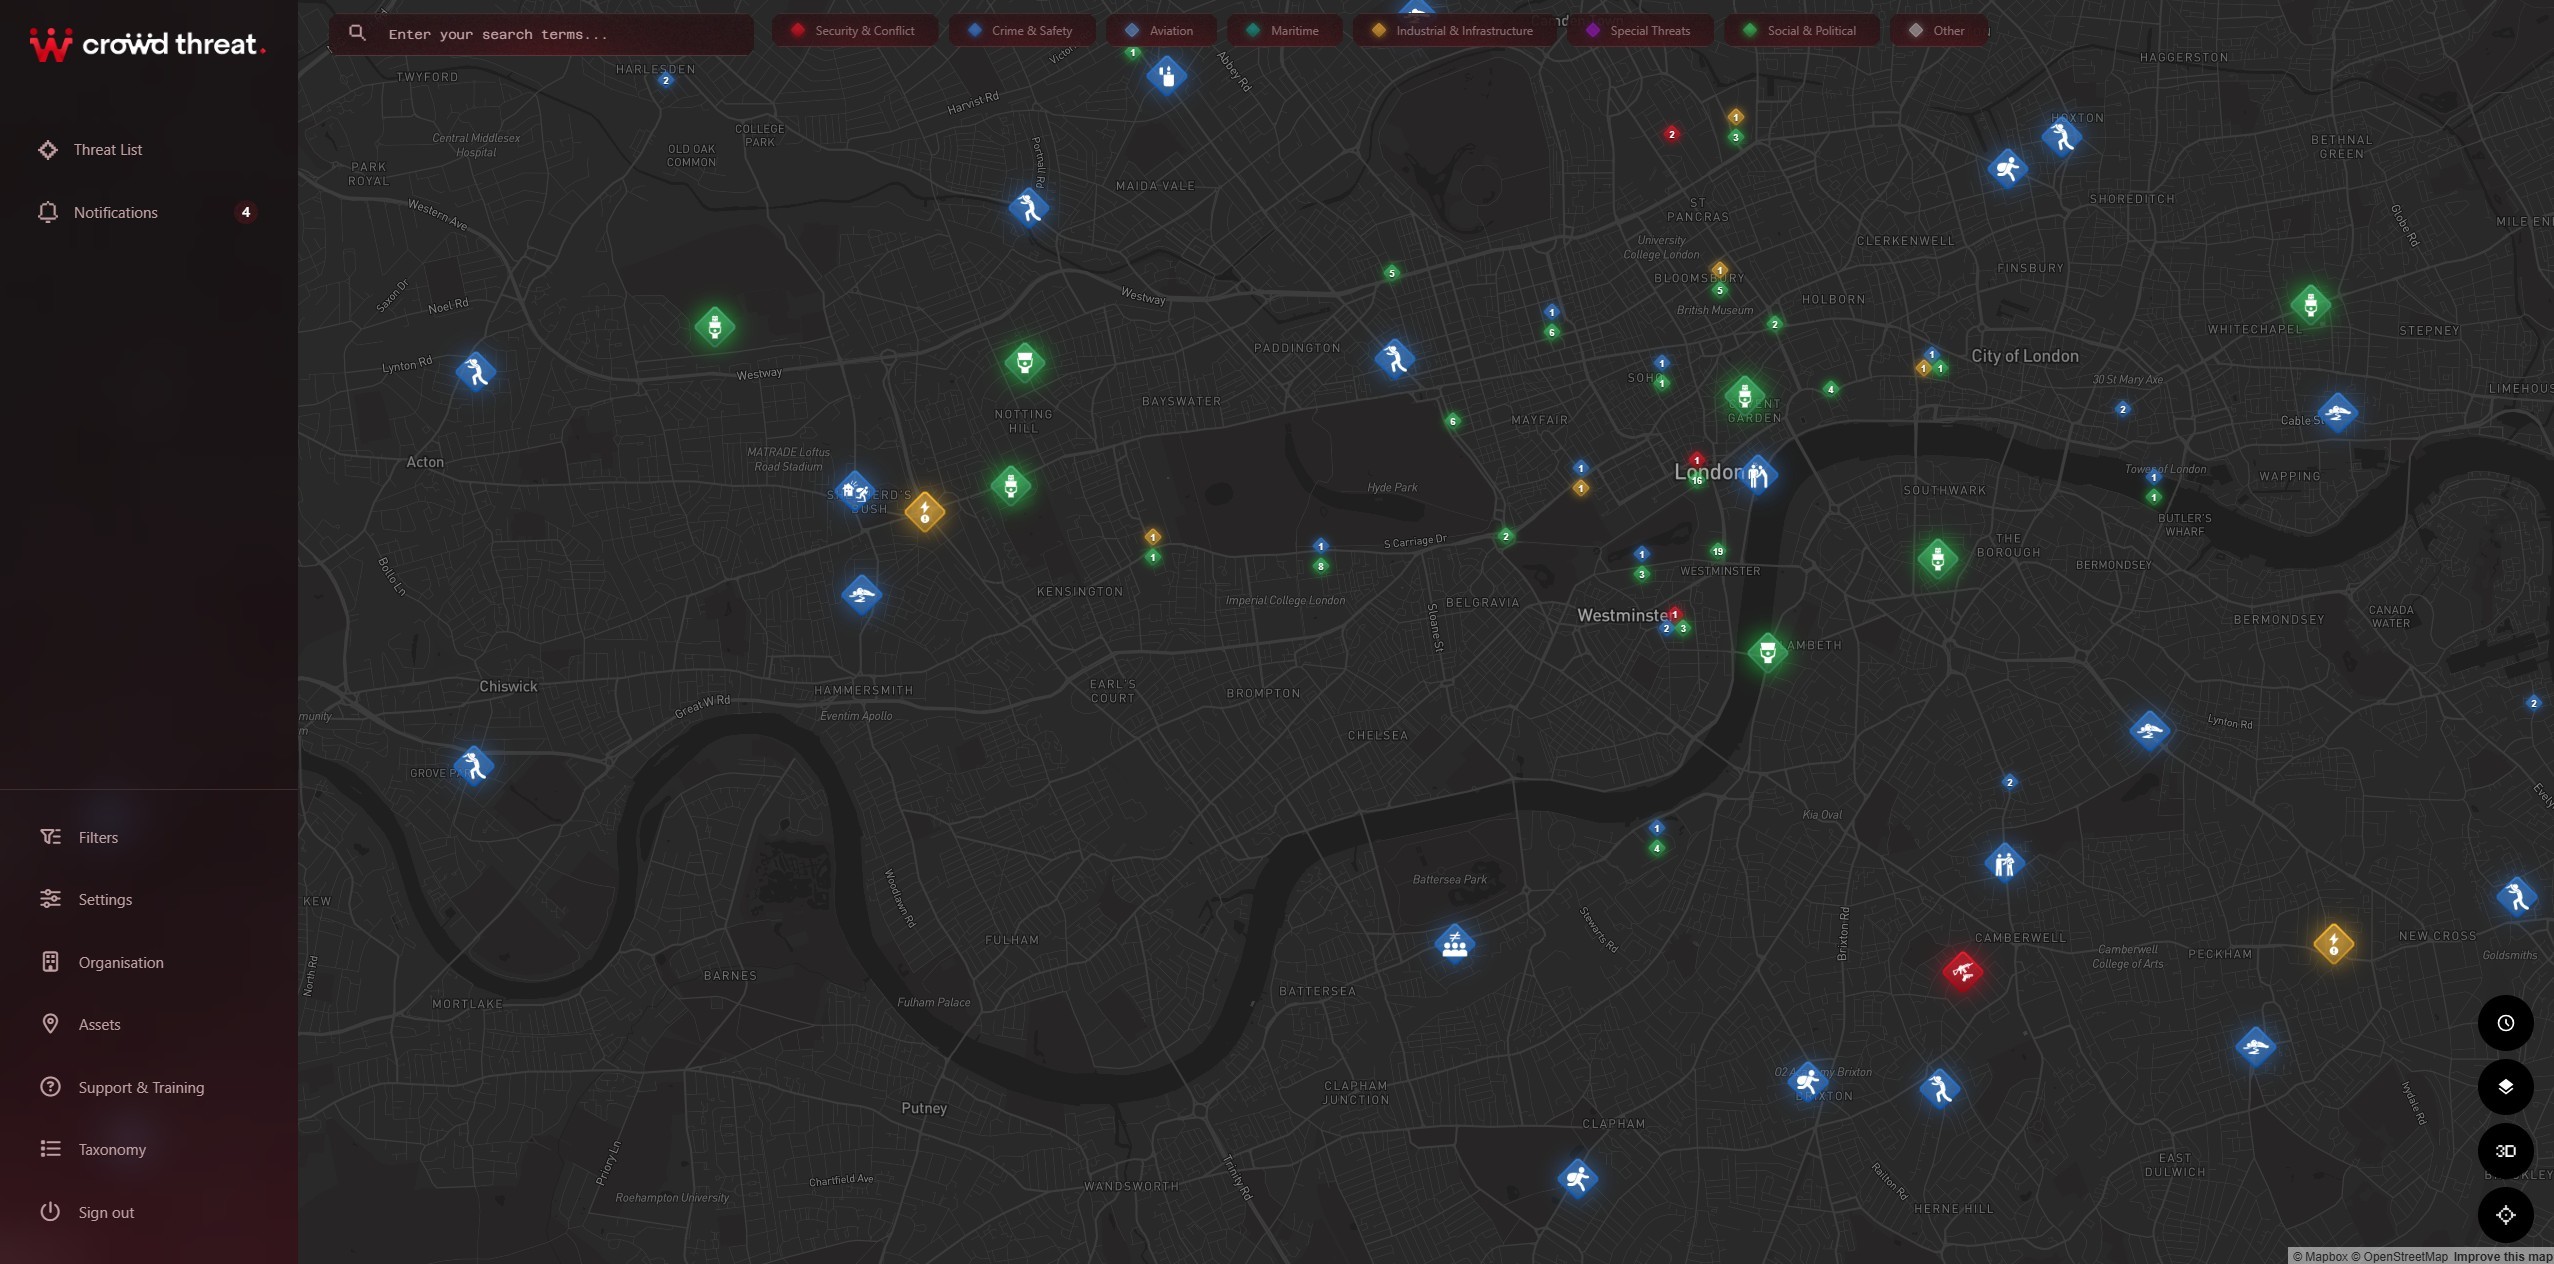
Crowd Threat · Live Now
Crowd Survey
Coming Soon
Crowd Signal
Founding Access
Verified ground-truth data.
What can you do with it?

Crowd Threat is live — a global network of verified local reporters submitting real-time incident intelligence before it reaches any wire, aggregator, or public channel. Crowd Survey is coming: a 30-day forward stability forecast, built from 7 leading indicators, in every country we cover. Crowd Signal maps every verified incident to live prediction markets.

app.crowdthreat.world
Live
Crowd Threat platform
Products
One crowd. Three intelligence layers.

Every product is powered by the same asset — a global network of vetted local reporters submitting verified incidents the moment they occur. The same data feeds Crowd Threat, Crowd Survey, and Crowd Signal — each calibrated for a different analytical need.

Shared foundation

All three products are built on the same verified incident data. Subscribe to Crowd Threat, Crowd Survey, or Crowd Signal — or combine them for the full intelligence stack.

Book a Demo
Global Reporter Network
0+ local reporters.
Every corner of the world.

Our crowd isn't a database or an algorithm — it's a global network of real people, vetted and financially accountable, submitting verified incidents from the communities where they live. When something happens, they're already there.

United Kingdom
United States
Germany
Spain
Nigeria
Italy
Indonesia
India
Australia
France
0+
Reporters
10
Countries
↑ Growing
Network
Live · Expanding
The Proof
0%
Before they occur

Threats recorded before they have even happened — planned demonstrations, mobilisations, and pre-incident activity captured by reporters already embedded in those communities.

0%
Within 2 hours

Further threats captured within two hours of onset — when most intelligence platforms are still silent or scraping recycled feeds.

0+
Vetted reporters

And expanding. Every addition extends coverage into corners no algorithm, desk analyst, or satellite feed can reach.

The Architecture
The future of threat intelligence
isn't a bigger desk.
01
01The Desk

The world has been running on the same model for decades. A company builds a team of analysts — smart people, sitting at desks, reading news feeds and government alerts and social media, and logging incidents one by one. It works. The problem is the maths. Twenty analysts have to cover 168 hours a week across 195 countries. So they don't. They cover the countries clients are paying for, during business hours, in the time zones that matter to the paying customers. On a Saturday night, there are one or two people watching the planet. That's not a staffing problem. It's a structural one — and hiring more people doesn't fix it, it just doubles the bill.

02
02The Shortcut

So the market tried a shortcut. Build platforms that pull in data from dozens of sources, run it through AI, and publish it automatically. Fast, cheap, scalable. Except the data isn't original — it's re-packaged from feeds the platform licences from other providers. The AI can't distinguish a genuine report from a recycled video that's three years old and thousands of miles from the claimed location. The platforms that do this well spend tens of millions a year on feed licences and need their AI models retrained every single day to keep up. The ones cutting corners on that are quietly publishing misinformation as intelligence.

03
03Data Aggregation

The next attempt was more industrious. Build pipelines that hunt raw government data — 911 calls, police logs, city clerk PDFs, API endpoints buried in municipal websites. Standardise it. Then use AI to model down to street level, inferring what you can't source from demographic and geographic proxies.

It works — in cities where governments publish reliable, consistent data. But in Venezuela, the government stopped releasing official crime statistics years ago. In Niamey, there is no 911 system. And here's the problem no model can solve: every city is unique. Comparing Cape Town to Paris with the same algorithm is like reading a map drawn by someone who's never left the office. The coverage bar looks full. The confidence is borrowed.

04
04The Crowd

The crowd model starts from a different premise. Instead of watching the world from a desk, you put people in it. Local reporters — residents, not tourists — who file from where events actually happen. No shift pattern. No collection plan based on client spend. No recycled content laundered through an AI. The event happens, the person who lives there files it, a human verifier checks it, and it's published. That's it.

In an age of misinformation, only a real human who was there can tell you what actually happened. Crowd Survey adds another layer: the same reporters answer weekly questions about security, sentiment, and economic conditions. That's how we capture the pre-escalation signal — the deteriorating mood, the rising tension, the changed behaviour — before any incident has occurred. You have to be there first.

The method is obvious.

Not a satellite. Not a newsroom. A person. On the ground. Who knows.

Verification
From noise
to verified signal.
In minutes.

Every alert that leaves our platform has been through this. Raw signal from a reporter on the ground. AI triage. Human corroboration.

RAW SIGNAL
Signal received · coordinates unknown · source unverified
AI TRIAGE
Coordinates resolve · category assigned · timestamp locked
CROSS-REFERENCING
Reporter trust confirmed · 3 sources corroborated
VERIFIED
Alert fires · 94 minutes ahead of any public wire
94 minutes ahead of Reuters wire
STANDBY
CT · VERIFY · 2.1
SIGNAL ID???-????-???-????
COORDINATES██.████°N ██.████°E
TIMESTAMP████████ LOCAL TIME
CATEGORYUNKNOWN
SOURCEUNVERIFIED
DESCRIPTION
████████ ██████ ██ ██████████ ████████ ██ █████ ████████ ████████ ██ ████
CONFIDENCE---
UNVERIFIED
Intelligence Cycle
The data advantage
at every stage.

Three products. One crowd. The same verified data feeds different intelligence layers — each calibrated to where you are in the cycle.

Ground truth layerPHASE 3/5

High-volume verified incidents with precise geolocation and timestamps. The data your competitors are scraping — we generate it first.

01
Pre-escalation
02
Onset of instability
03
Active incident
04
Post-incident
05
Strategic horizon
Live Feed
No signal
Nothing in open sources
Low volume
Noise vs. escalation unclear
Ground truth
High-volume verified incidents
Declining
May mask ongoing instability
Historical baseline
Regional risk by asset class
Stability Vector™
↓ Alert · T−14d signal
Leading indicator
Stress before incidents appear
Confirms escalation
Security & sentiment drop together
Participation falls
Negative scores confirm severity
Recovery tracker
Real stability, not just quiet
Stability Vector™
Quantified country risk scores
Trader Product
↓ BEARISH9% YES
▲ 12 PP implied delta▲65 min edge
Position before consensus
Survey divergence flags early — enter before price moves
Confirm the move
Threat + Survey convergence kills false starts
Manage peak risk
Incident density shows when impact tops out
Exit before the crowd
Survey flags secondary escalation risk early
Build the model
Human-sourced data no other provider has
Verified incident data
Stability Vector™
Trader intelligence
Crowd Threat — local eyes on global threats
Integrations
Where does it sit in your stack?

Crowd Threat is a complementary data layer — not a replacement. Here's how different teams put it to work alongside what they already use.

Existing TI Platforms

Already using a threat intelligence platform? Crowd Threat's API sits alongside it as a complementary verified incident layer — covering the ground-level events that scrapers and aggregators miss.

Prediction Market Tools

Crowd Signal maps verified incident data directly to live geopolitical prediction markets — providing the information asymmetry layer that public information sources cannot supply.

Crisis & Emergency Management

Crisis management platforms and emergency response teams use the real-time feed to detect and respond to incidents in protected zones — with verified ground-truth rather than social media noise.

Risk & Insurance Underwriting

Political risk underwriters use Crowd Survey's Stability Vector as a leading indicator for country risk exposure, and Crowd Threat incident data as the evidentiary layer for event-driven claims.

Analytics & Data Science

Data science teams and analytical platforms ingest our high-volume, real-time incident stream as training data or input signals for predictive models and situational intelligence tools.

News & Media Monitoring

Newsrooms and wire services use Crowd Threat for early detection of breaking incidents in under-reported regions — identifying stories before they surface in any public channel.

Full REST API · Webhook support · JSON / CSV export · Custom field mapping

Crowd Survey
Survey Programme
Three tiers. One signal stack.

Crowd Survey is built on a three-tier contributor programme — each tier capturing a different temporal layer of stability intelligence. Together they produce a signal stack that no scraper, news aggregator, or satellite system can replicate.

Daily
First signal
Weekly
Structural trend
Monthly
Slow indicators
Daily Pulse
Daily Pulse
£0.15–0.20
per completion
Every day
~60 seconds
2–3 questions

Rapid daily check-ins that capture the first signals of deterioration. Questions rotate from a bank of 21 spanning security, economics, movement, and community mood. Triggers analytics when 25%+ of regional contributors report deterioration within 48 hours.

Security & Safety
Economic Signals
Behavioural & Movement
Mood & Sentiment
Weekly Structured
Weekly Structured
£0.75–1.00
per completion
Once per week
~4 minutes
8–12 questions

Structured thematic surveys that track the five core stability dimensions. Four versions (A/B/C/D) rotate monthly. Dimension 5 — Forward Expectation — is always included and provides the primary input for the Stability Vector direction and velocity metrics.

Security Environment
Economic Conditions
Social Cohesion
Political Temperature
Forward Expectation (always)
Monthly Deep Survey
Monthly Deep Survey
£2.50–3.00
per completion
Once per month
~12 minutes
20–30 questions

Deep structural indicators — the slow-moving signals that are the most reliable medium-term predictors of instability. Covers institutional trust, inter-community relations, economic trajectory, migration intention, and governance legitimacy.

Institutional Trust
Inter-Community Relations
Economic Trajectory
Migration Intention
Governance Legitimacy
Accuracy Bonus
Top 10% of accurate reporters earn a bonus multiplier.

Survey responses are compared against known events after the fact. Top performers earn a permanent multiplier on all survey pay — rewarding quality over quantity.

+25%
Bonus on all survey pay
Register for Access
Get Started
See the data in action.

Request a personalised demo and we'll walk you through the use case most relevant to your team — GSOC monitoring, prediction market alpha, political risk, or API integration.
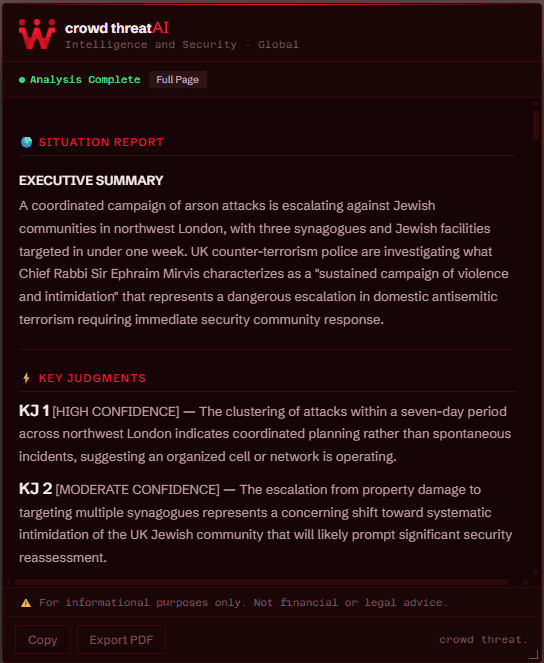
CT AI Chrome Extension
◆ CT AI · Chrome Extension

Intelligence from any webpage.
In under 30 seconds.

Right-click any article, threat report, news story, or advisory. Get a full structured intelligence brief — built to the same standard as reports that used to take analysts hours to write. Filtered through your sector, your locations, your risk profile.

Add to ChromeFree · No account needed
Contact
contact@crowdthreat.com
15A Cobalt Business Park
Quick Silver Way
Newcastle Upon Tyne
NE27 0QQ
United Kingdom
SSEA 2026 FINALIST
MARKET DISRUPTOR OF THE YEAR
©2026 Crowd Threat Limited. All rights reserved.